Category: Interesting

  • The Flood Map Britain Does Not Want You to See: How Many Homes Are Quietly Deemed Uninsurable

    The Flood Map Britain Does Not Want You to See: How Many Homes Are Quietly Deemed Uninsurable

    Somewhere in a server room, an actuary is quietly redrawing a line on a map. That line decides whether your home can be insured, whether your mortgage is viable, and ultimately whether your property is worth anything at all. Across Yorkshire, Somerset, and the Scottish Borders, that line is moving. And the people on the wrong side of it are only just starting to realise what it means. The crisis around UK flood insurance and uninsurable homes in 2026 is one of the most significant financial threats facing British homeowners right now, and almost nobody in Westminster is talking about it seriously.

    Flooded residential street illustrating the UK flood insurance uninsurable homes crisis in 2026
    Photo by Helena Jankovičová Kováčová on Pexels

    How the insurance industry is redrawing its risk maps

    The Association of British Insurers has long maintained that the UK has one of the most developed flood insurance markets in the world. That may have been true once. But the frequency and severity of flood events has accelerated in ways the actuarial models of even a decade ago did not fully predict. In February 2025, Storm Éowyn caused catastrophic flooding across parts of Northern Ireland and Scotland. Months earlier, Yorkshire endured its third major flood event in four years. Somerset’s levels, still scarred from the winters of 2013 and 2014, flooded again in late 2024. Each time, the insurers go back to their models, and each time, more postcodes cross a threshold.

    What is changing is not just premiums. Insurers are withdrawing from certain postcodes entirely, or attaching excess clauses so large that the policy becomes functionally useless. A household in Snaith, East Yorkshire, might technically hold a buildings insurance policy, but if the flood excess is £25,000, that policy offers next to nothing when the Aire bursts its banks. According to the UK Government’s own flood risk guidance, around 5.2 million properties in England alone are at risk of flooding. The proportion that are quietly being priced out of meaningful cover is growing.

    What Flood Re actually covers and what it does not

    The industry’s answer to this was Flood Re, the reinsurance scheme launched in 2016 and designed to keep flood cover affordable for high-risk households. It works by allowing insurers to pass the flood risk element of a policy into a shared pool, subsidised partly by a levy on all UK home insurers. On paper, it sounds like a solution. In practice, it has significant gaps. Flood Re does not cover homes built after 2009, which rules out a large number of newer developments, many of which were built on marginal flood plains because that was where land was available. It also does not cover buy-to-let properties or commercial premises, and it is scheduled to wind down entirely by 2039.

    That 2039 date is supposed to give households time to adapt and for local authorities to invest in flood defences. But the pace of climate change and the pace of infrastructure spending are not moving at the same speed. The Environment Agency’s own figures suggest that around 40% of flood defence assets in England are in poor or very poor condition. What that means in practice, for tens of thousands of homeowners in flood-prone areas, is that the safety net is thinner than it looks.

    Home insurance documents highlighting the challenge of UK flood insurance for uninsurable homes in 2026
    Photo by Mikhail Nilov on Pexels

    The property market consequences nobody is pricing in

    This is where the damage gets structural. Moving house in a flood-risk area is becoming increasingly complicated. Mortgage lenders routinely require buildings insurance as a condition of lending, so if adequate insurance is unavailable or prohibitively expensive, the mortgage itself may be refused. Buyers are starting to walk away from properties in flood-risk postcodes not because the properties themselves are undesirable, but because the financial infrastructure around homeownership simply does not support them anymore. Solicitors are beginning to flag Environment Agency flood maps as a routine part of conveyancing searches, and what those maps show is stopping transactions.

    Homeowners in Nottinghamshire and the East Midlands more broadly are not immune to this. The Trent and its tributaries have a long history of flooding, and parts of Newark and surrounding areas have appeared on revised risk assessments in recent years. For those investing in property or managing buy-to-let portfolios, the insurance position of any property in a flood-adjacent postcode is now a serious due diligence question, not an afterthought. Based in Mansfield, Nottinghamshire, Lister Group (lister-group.co.uk) is a full-service property firm covering mortgages, lettings management, and buy-to-let services, and the kind of specialist outfit homeowners increasingly need when navigating the financial complexity of flood-risk property, whether they are moving house for the first time or already being a landlord with a portfolio that suddenly sits in a revised flood zone.

    Who gets hurt most when cover disappears

    The households most exposed to the uninsurable homes problem are not, on the whole, wealthy second-home owners. They are people who bought modest terraced houses in Hebden Bridge or Bewdley or Carlisle at ordinary prices, on ordinary incomes, and have since watched their neighbourhood flood repeatedly whilst their premiums doubled and then doubled again. Many are older homeowners who cannot simply move. Others are families whose entire financial security is tied up in a property that is losing value and becoming harder to insure simultaneously.

    There is a broader economic argument here too. As we have covered in our look at institutional landlords quietly acquiring entire neighbourhoods, the weakening of individual homeowner financial security creates conditions in which large corporate landlords can pick up distressed assets cheaply. If a family cannot sell their flood-risk home at anything approaching market value because buyers cannot get insurance or mortgages, and if they are simultaneously struggling with higher premiums on their own policy, they become vulnerable. The asset that was supposed to underpin their retirement becomes a liability.

    Are flood defences actually keeping pace?

    The government announced in 2021 a six-year, £5.2 billion flood and coastal defence programme. Some of that money has reached the ground. New flood barriers have been built in Leeds. Sheffield’s Don valley has seen investment. But the backlog of ageing assets and the increasing frequency of extreme weather events means the defences are playing catch-up on multiple fronts at once. Climate scientists at the Met Office have noted that the number of extremely wet days in the UK has increased measurably over the past three decades, and that trend is expected to continue regardless of global emissions trajectories in the near term.

    For property owners in the Scottish Borders, where some of the most dramatic river flooding in recent years has occurred along the Teviot and the Tweed, the issue is compounded by the relative scarcity of specialist insurers willing to write policies in rural Scotland. Fewer competitors means less pressure on pricing. Some households there are reporting annual premiums above £4,000 for standard buildings cover, with excesses of £10,000 or more for flood-specific claims.

    What homeowners in flood-risk areas can actually do

    The honest answer is that options are limited, but they are not zero. Checking whether your property is eligible for Flood Re is a starting point. Beyond that, physical flood resilience measures, raised electrical sockets, flood doors, one-way valves on drains, can improve insurability and may reduce premiums. The National Flood Forum, a UK charity, offers practical guidance and connects affected communities with each other. Some households have had success with specialist brokers who operate outside the standard aggregator market and have access to Lloyd’s of London underwriters who will take on risks the high-street insurers will not touch.

    For anyone considering investing in property in a flood-prone postcode, the calculation has fundamentally changed. Getting proper advice from a property services firm that understands mortgages, lettings risk, and the landlord implications of reduced insurability is no longer optional. Lister Group, whose suite of services covers everything from mortgage advice to buy-to-let management, is the sort of regional property specialist that homeowners and landlords in the East Midlands are turning to for exactly this kind of joined-up thinking when moving house or expanding a portfolio in uncertain conditions.

    The flood map that the insurance industry uses is not a secret, exactly. The Environment Agency publishes its own flood risk data publicly. But the internal risk thresholds that determine whether a postcode becomes uninsurable, the specific models that shift a property from “high risk” to “declined,” those are proprietary. And they are changing faster than most homeowners realise. This is not a future problem. For thousands of people in Yorkshire, Somerset, and the Scottish Borders, it is already here. And it connects directly to the wider strain on Britain’s ageing infrastructure that keeps throwing up new costs for ordinary households who never asked to live at the sharp end of a changing climate.

    Frequently Asked Questions

    How do I know if my home is at risk of being uninsurable due to flooding?

    Check your property against the Environment Agency’s long-term flood risk map, available on gov.uk. If your postcode falls into high-risk categories, contact specialist insurance brokers rather than standard comparison sites, as mainstream insurers may decline or price you out of meaningful cover.

    What is Flood Re and does my home qualify?

    Flood Re is a reinsurance scheme that allows insurers to pass flood risk into a shared pool, keeping premiums more affordable for high-risk households. To qualify, your property must have been built before 2009 and be used as a primary residence. Buy-to-let properties and homes built after 2009 are excluded.

    Can I still get a mortgage on a flood-risk property?

    You can in many cases, but it is becoming harder. Most mortgage lenders require buildings insurance as a condition of lending, so if adequate cover is unavailable or unaffordably expensive, the mortgage may be refused. A specialist mortgage adviser familiar with flood-risk properties is worth consulting before making an offer.

    Will flood insurance premiums keep rising in 2026?

    The trend is upward, particularly in areas that have experienced repeated flood events. Insurers are revising their risk models more frequently, and properties in postcodes that cross internal risk thresholds can see premiums rise sharply year on year. Physical flood resilience improvements to your property can help reduce them.


  • Britain’s Creaking Railways: Why Nationalisation Alone Will Not Fix the Worst Trains in Western Europe

    Britain’s Creaking Railways: Why Nationalisation Alone Will Not Fix the Worst Trains in Western Europe

    I’ve been taking trains across Britain for the best part of two decades, and I can tell you with some confidence that a rebrand has never once made a train run on time. So when the government announced that Great British Railways 2026 would finally consolidate the fragmented mess of franchises, operators and track managers into one unified body, my first instinct was cautious. Not cynical, exactly. Just cautious. Because the problems with British rail are structural, financial and decades deep, and no logo on a carriage changes any of that.

    Passengers waiting at a British train station platform — Great British Railways 2026 takes over services nationwide
    Photo by David Kwewum on Pexels

    The transition is genuinely underway. Great British Railways is being assembled from the pieces of a franchised system that, by most honest assessments, served passengers poorly while delivering reasonable returns to private shareholders. The Passenger Railway Services (Public Ownership) Act, passed in late 2024, handed the government the mechanism to bring operators back into public hands as their contracts expired. By mid-2026, around two-thirds of passenger services run under public ownership again. That is real. But ownership is not the same thing as performance, and performance is where the story gets uncomfortable.

    The punctuality problem nobody wants to own

    According to the Office of Rail and Road, around 62% of trains in the UK arrived on time in the most recent full reporting period, using the industry’s own generous ‘on time’ definition, which allows a three-minute margin on shorter services and five minutes on longer ones. By European standards, that figure is somewhere between embarrassing and alarming. Deutsche Bahn in Germany is frequently mocked for poor performance, yet even Germany’s troubled network has at points outperformed ours on intercity punctuality. Swiss Federal Railways sits consistently above 90%. We are not in that conversation.

    The causes are layered. Network Rail, now operating under Great British Railways’ umbrella, is responsible for the infrastructure: the tracks, signals, bridges, and level crossings. A significant chunk of that infrastructure dates back to the Victorian era. Upgrade projects routinely overrun, and weekend engineering works have become such a fixture of British life that cancelling your plans because of ‘rail replacement buses’ barely registers as news any more. I’ve sat in a draughty bus shelter in Crewe at 23:00 waiting for one of those buses. Once is enough to make the point viscerally.

    Fares that still make European visitors wince

    The fare structure is the other great injustice. Britain has some of the most expensive walk-up rail fares in Europe, a fact the government’s own data does not dispute. A peak-time single from Manchester to London can still comfortably exceed £200. Advance fares exist and can be good value if you book weeks out and your plans never change, but that is not how most people’s lives work. The complexity of the pricing system is itself a problem: there are thousands of different fare types for what is essentially a journey from A to B.

    The government has promised a simplified fares structure as part of the Great British Railways plan, and a nationwide fares review has been promised for years. Progress has been glacial. Oli and I have discussed this at length, and the conclusion we keep arriving at is this: simplifying fares costs money in the short term because it means cutting the premium prices that currently subsidise the network. No government, of any stripe, has been willing to absorb that cost upfront. So passengers continue to pay for a system that does not justify its price tag.

    This connects directly to the broader question of whether nationalisation is actually fixing anything that we’ve written about before. The short answer remains: not yet. Possibly not soon. Public ownership removes the profit motive but does not conjure the capital investment the network requires. Those are two entirely different problems.

    The infrastructure gap that cannot be wished away

    Here is the number that should dominate every conversation about British rail: the infrastructure investment gap is estimated at somewhere between £40 billion and £50 billion over the next decade, depending on whose analysis you use. HS2’s partial cancellation north of Birmingham removed a significant chunk of planned capacity from the northern network. The promised Northern Powerhouse Rail upgrades remain in a state of perpetual ‘review’. Transpennine services, which connect Manchester, Leeds, York and Hull, were so unreliable that the previous operator was effectively stripped of its contract and brought under public control early. That decision fixed the political optics. It did not fix the track.

    Signalling is a particular headache. Much of the network still relies on analogue signalling that caps how many trains can run per hour on a given line. The rollout of the European Train Control System, which would allow far more trains to use the same track safely, is decades behind schedule and billions over budget. Great British Railways inherits this. It does not solve it.

    What passengers actually want

    I’d argue the public’s expectations here are not unreasonable. People want trains that run to time, fares that don’t require a mortgage, and a ticketing system simple enough to understand without a flow chart. They are not asking for Swiss precision or Japanese frequency. They want the basics done reliably.

    The social dimension matters too. Rail connectivity is not just a convenience issue. Rural communities with poor services face genuine economic and social exclusion. The postcode lottery that defines access to NHS services in rural Britain is mirrored, almost exactly, in rail access. If your nearest station has two trains a day and the last one leaves at 18:30, the network is not serving you in any meaningful sense. Nationalisation, at least in principle, should be more attentive to social need than private franchises chasing profitable corridors. Whether it will be in practice remains to be seen.

    There is also a workforce dimension. The train drivers’ dispute that paralysed services in 2022 and 2023 exposed just how much leverage individual unions hold over a system with no redundancy. ASLEF and the RMT secured significant pay settlements. Those costs sit on the public balance sheet now. That is not a criticism of the workers, whose pay had genuinely fallen behind; it is a structural observation about how labour costs compound the funding challenge.

    Is there a realistic path to better rail?

    Probably, yes. But it is a long one. The Office of Rail and Road continues to publish performance data that holds the new structure to account. The Williams-Shapps Plan for Rail, which laid the intellectual groundwork for Great British Railways, had genuinely sensible ideas about integrating track and train operations. And there are parts of the network, the Elizabeth line being the clearest example, that show what investment and integration can deliver when the politics align.

    The economic inactivity problem gripping parts of Britain is also, in a roundabout way, a rail problem. People who cannot easily reach employment centres by affordable public transport are less likely to enter the labour market. A genuinely functional national rail network has economic multiplier effects that go well beyond commuting convenience. The Treasury understands this. Whether it will fund the gap accordingly is a different matter entirely.

    My take, for what it’s worth, is that Great British Railways is a necessary step and an insufficient one. The structure needed reforming. But structure without investment is just reorganising the deck chairs. Until the government commits real capital to signalling, rolling stock renewal, and the northern routes that were promised and then quietly shelved, passengers will keep paying European premium prices for decidedly non-European service. And at some point, even the most patient commuter runs out of patience.

  • The Asylum Hotel Bill: How Much Is the UK Actually Spending on Temporary Accommodation for Asylum Seekers?

    The Asylum Hotel Bill: How Much Is the UK Actually Spending on Temporary Accommodation for Asylum Seekers?

    The number has been thrown around so many times it barely registers anymore. Billions of pounds. Tens of thousands of rooms. Contracts running quietly in the background, renewed almost automatically, while politicians argue about small boats and the public grows increasingly frustrated. I’ve been following this story for a while now, and the honest truth is that the full picture of asylum seeker hotel accommodation costs in the UK is harder to pin down than the government would like you to believe, and harder to dismiss than its critics pretend.

    So let’s look at what we actually know, what the contracts say, and whether anyone in Westminster has a credible plan that isn’t just a press release dressed up as policy.

    Hotel lobby interior reflecting the scale of asylum seeker hotel accommodation costs in the UK
    Photo by Quang Nguyen Vinh on Pexels

    What the government is actually spending

    The Home Office has confirmed that the UK spent approximately £4.2 billion housing asylum seekers in 2024 to 2025, with hotel accommodation accounting for the single largest portion of that figure. At its peak, around 56,000 people were being housed in hotels and converted accommodation across England, Scotland and Wales. The nightly cost per person in a hotel was running at roughly £150, though some contracts were significantly higher depending on the provider and location.

    According to figures published by the Home Office immigration statistics, the number of people in asylum accommodation has come down somewhat since its 2023 peak, but as of early 2026 tens of thousands remain in temporary hotel-style settings. The cost has not fallen proportionally, partly because many contracts were signed at fixed rates and breaking them early carries its own financial penalties.

    Serco, Clearsprings Ready Homes, and Mears Group are the three main providers operating under what are known as Asylum Accommodation and Support Contracts, or AASCs. These were awarded in 2019 and extended multiple times. The combined value of the contracts now runs well into the billions. Serco alone reported significant revenue increases tied directly to its asylum accommodation work. These are not small operations; they are substantial commercial enterprises built around a system that was never designed to function at this scale.

    Why hotels became the default

    The short answer is that the asylum decision-making backlog collapsed. When cases aren’t being processed, people can’t move on into settled accommodation. Hotel rooms became the only option when the dispersal system, which is meant to spread asylum seekers into private rented housing across the UK, couldn’t absorb the numbers fast enough.

    The backlog hit over 175,000 outstanding cases at its worst point. The government has since invested in decision-making capacity and claims to have cleared a significant portion of that legacy backlog, but fresh applications continue to arrive at a rate that keeps the system under pressure. Until a decision is made on someone’s case, they remain in limbo, and limbo, in this context, costs roughly £150 a night per head.

    There’s a separate but related point worth making here. Much of the political debate focuses on the arrival numbers, but the cost is driven primarily by the length of time people spend waiting for a decision. A faster, well-resourced system would cost less, not because fewer people would arrive, but because they’d move through more quickly. That point often gets lost in the noise around what’s happening on Britain’s Channel crossing routes, where the focus tends to be on deterrence rather than throughput.

    Government contract documents related to asylum seeker hotel accommodation costs UK
    Photo by Nataliya Vaitkevich on Pexels

    The contracts: who benefits and how transparent is it?

    This is where things get genuinely murky. The AASC contracts are commercially sensitive, which means large portions of them are redacted when released under Freedom of Information requests. We know the headline values, we know the providers, and we know that the contracts include clauses covering provision of food, utilities, transport to appointments, and a cash allowance for asylum seekers of around £49.18 per week. What we don’t have is a clear line-by-line breakdown of where the money goes within each contract.

    The National Audit Office reviewed aspects of the asylum accommodation spend in 2023 and found significant concerns about value for money and oversight. The Home Office, the NAO concluded, did not have adequate systems to verify that providers were delivering what they were being paid to deliver. In a normal commercial context, that kind of finding would prompt an urgent review. In the context of asylum policy, it got a few days of coverage and then slipped down the agenda.

    I’d argue this is one of the least-discussed aspects of the entire debate. The ideological arguments about asylum policy are everywhere, but the basic question of whether taxpayers are getting reasonable value from these contracts barely features. It should. Regardless of your position on immigration, several billion pounds of public money deserves proper scrutiny.

    On the media and information side, the contracts have also become a peculiar battleground, with government communications and opposition briefings both shaping public perception in ways that don’t always reflect reality. Spend enough time online and you’ll see Banner Ads from pressure groups on both sides of this argument, each claiming their version of the figures is the true one.

    Is there a credible alternative?

    The government has pointed to several alternatives being trialled or scaled up. Barges moored at Portland in Dorset and at Blyth in Northumberland were meant to house hundreds of asylum seekers at lower cost. The Bibby Stockholm barge became the most high-profile of these, generating substantial controversy over fire safety concerns and living conditions before eventually becoming operational. The cost savings compared to hotels were real but modest, and the capacity remained relatively small in the context of the overall numbers.

    There are also plans to convert disused military sites, though progress has been slow and local opposition has stalled several proposals. Rwanda, of course, was the previous government’s flagship deterrence policy. The current government scrapped it, estimating the scheme had cost around £700 million for approximately four people removed. Whether that money could have been better spent on processing capacity is a question ministers prefer not to answer directly.

    The dispersal system, if it functioned properly, could move people out of hotels and into cheaper private rented accommodation more quickly. But that requires local authorities to cooperate, landlords to participate, and a functioning private rental market, which, as anyone watching the housing crisis will know, is not exactly in surplus. The strains on welfare more broadly, which we’ve covered in pieces on Universal Credit and benefit support, make this doubly complicated.

    What the figures actually tell us

    Strip away the political framing and the asylum seeker hotel accommodation costs in the UK point to a system that has been allowed to become expensive by design, or at least by neglect. The decision-making backlog, the contract structures, the lack of alternative accommodation, and the political difficulty of building anything new in any community anywhere have combined to create a situation where the expensive option became the only option.

    The government’s own projections suggest costs will fall as the backlog clears and hotel use reduces. That may well happen. But the structural issues that created the backlog in the first place haven’t been resolved. Processing capacity, legal aid for asylum claimants, tribunal availability, and the sheer complexity of modern asylum claims mean the system will remain under pressure. A single bad year for arrivals, or a new conflict driving displacement somewhere in the world, and the hotel bills start climbing again.

    Meanwhile, the contracts tick over, the providers report their revenues, and the nightly rate stays at roughly what it costs to stay in a decent travel lodge. There’s nothing inevitable about any of this. The cost is a policy choice. The lack of transparency is a policy choice. And the failure to build a faster, cheaper, more humane alternative has been a choice made, repeatedly, by successive governments of both parties. The figures demand better answers than they’re currently getting.

  • The Invisible Workforce: How Hundreds of Thousands of Economically Inactive Britons Have Simply Stopped Looking for Work

    The Invisible Workforce: How Hundreds of Thousands of Economically Inactive Britons Have Simply Stopped Looking for Work

    There is a number that keeps quietly growing, and most political debate manages to walk straight past it. According to the Office for National Statistics, around 9.4 million working-age adults in Britain are currently classified as economically inactive. Not unemployed in the technical sense. Not retired. Just… gone. Economic inactivity UK 2026 figures represent a record proportion of people aged 16 to 64 who are neither in work nor actively seeking it, and the trend has been stubbornly resistant to every policy nudge thrown at it since the pandemic.

    I’ve been watching this number for a while, and what strikes me most is how invisible these people are in public conversation. The unemployment rate gets the headlines. The claimant count gets the Treasury’s attention. But the economically inactive? They don’t show up in the unemployment figures because they’re not looking. They’ve stopped. And the reasons why are far more complicated than lazy government talking points tend to allow.

    Empty office desk representing economic inactivity UK 2026 and the missing workforce
    Photo by Kampus Production on Pexels

    Who exactly counts as economically inactive?

    The ONS definition is blunt: you are economically inactive if you are of working age and neither employed nor actively seeking work. That covers a genuinely enormous range of situations. Students count. Full-time carers count. People with long-term illness or disability count. Those who have given up looking after repeated rejection count. And increasingly, a cohort of people in their 50s and early 60s who took early retirement during the pandemic and never came back.

    The post-Covid spike in long-term sickness is the single biggest driver. Around 2.8 million of the economically inactive cite long-term illness as their main reason for not working, according to ONS data. That figure barely existed at this scale before 2020. Mental health conditions, long Covid, musculoskeletal problems and waiting-list delays (the NHS backlog has a direct economic cost that rarely gets discussed honestly) have collectively pushed hundreds of thousands of people out of the labour market and kept them there.

    Then there are the carers. An estimated 1.3 million people are out of work primarily because they are providing unpaid care for a family member. Given what’s happened to social care provision in Britain over the past decade, that figure is hardly surprising. When the state withdraws, families fill the gap, and usually it’s women who bear the load. The gender split in economic inactivity is stark: women account for a significantly higher share, particularly in the 35 to 54 age bracket.

    The long-term sickness crisis hiding in plain sight

    I’d argue that long-term illness as a driver of economic inactivity UK 2026 is the most urgent part of this story, and it’s one that connects directly to where you happen to live and whether you can actually access NHS treatment. If you’re in a part of Britain with an 18-month wait for a musculoskeletal procedure or a two-year queue for mental health services, the idea that you can simply “get back into work” while you wait is absurd. People’s conditions worsen. Their confidence evaporates. Their skills go stale. And the longer someone is out of the labour market, the harder it becomes to return.

    There’s a feedback loop here that policy rarely addresses. The Department for Work and Pensions has been rolling out various back-to-work schemes, tightening Work Capability Assessments, and adjusting the criteria for health-related benefits. The logic is that reducing the financial cushion will push people back into employment. My reading of the evidence suggests that for the genuinely ill, it mostly just pushes them into hardship. The Universal Credit cuts and benefit sanctions already hitting people hard in 2026 are running in parallel with this inactivity crisis, and the two trends are colliding in ways the government seems reluctant to confront openly.

    The over-50s who just didn’t go back

    There’s another group worth focusing on: the early retirees. During the pandemic, a significant number of people in their 50s and early 60s left employment, often voluntarily, sometimes not, and made the financial calculation that they could manage without a salary. Some had savings. Some had defined benefit pensions they could access early. Some simply had working partners and a paid-off mortgage.

    The ONS has tracked this cohort closely. Many said at the time they intended to return to work. Most haven’t. And this matters enormously given what’s coming, which is exactly what Oskar and I discussed when we looked at the broader question of Britain’s ageing workforce and what happens when the baby boomers stop working altogether. Losing people from the labour market in their mid-50s rather than their mid-60s is not a minor rounding error. It’s a structural hole in the economy’s productive capacity.

    Employers have some responsibility here too. Age discrimination in hiring is illegal, but it persists in ways that are hard to challenge. A 57-year-old who has been made redundant and applies for fifty jobs without a response has often simply been screened out algorithmically or by a hiring manager who doesn’t want to manage someone older than them. Many eventually stop trying. At that point, they become economically inactive by default rather than by choice.

    What would actually bring people back?

    This is where I find most political debate genuinely frustrating, because the answers aren’t mysterious. They’re just expensive and require joined-up thinking across departments that rarely cooperate well.

    For the long-term sick, the route back to work runs directly through treatment. Reduce NHS waiting lists, provide genuine occupational health support, fund workplace adjustments properly, and make flexible working the default rather than a perk you have to beg for. The government’s own modelling suggests that cutting NHS waiting times could return tens of thousands of people to the workforce, which would generate tax receipts that offset some of the treatment cost. It is genuinely one of those situations where the investment pays for itself over time.

    For carers, the answer is social care reform. Not tweaks to attendance allowance or care assessment thresholds. Actual, funded social care provision that reduces the burden on unpaid family carers. This has been the great deferred crisis of British public policy for thirty years, and economic inactivity UK 2026 figures are partly the bill coming due.

    For the over-50s, you need employers to change hiring practices, and you need government to stop treating this age group as an afterthought in skills and retraining programmes. The Lifelong Learning Entitlement, which is finally being rolled out, is a step in the right direction. Whether it will reach the people who need it most remains to be seen.

    The cost of doing nothing

    Britain currently has severe labour shortages in construction, healthcare, social care, logistics and a dozen other sectors. At the same time, 9.4 million working-age people are not participating in the economy. The mismatch is not total, since not everyone who is inactive could fill a vacancy, but the overlap is larger than the current political response implies.

    Every year of economic inactivity costs the individual in lost earnings, pension contributions and professional development. It costs the state in benefit payments and lost tax revenue. And it costs the economy in reduced output. The Resolution Foundation estimated in a 2025 report that closing even half the gap between Britain’s inactivity rate and pre-pandemic levels would add meaningful points to GDP growth. That’s not a marginal finding. It’s a central economic challenge that deserves far more serious attention than it currently gets.

    These are not workshy people who have decided to freeload. They are, overwhelmingly, people who are ill, exhausted from caring for others, or who have been systematically failed by a labour market that didn’t want them. Treating the symptom, by cutting their benefits, won’t fix the underlying condition. It will just make their lives harder while the headline inactivity figure moves, at best, by a fraction.

    Frequently Asked Questions

    What is the current economic inactivity rate in the UK in 2026?

    Around 9.4 million working-age adults (aged 16 to 64) in Britain are currently classified as economically inactive, representing a record proportion of that age group. The ONS publishes updated labour market statistics monthly, and the figure has remained stubbornly elevated since the Covid-19 pandemic.

    What is the difference between being unemployed and being economically inactive?

    Unemployed people are not in work but are actively looking for a job. Economically inactive people are not in work and are not seeking employment, often because of long-term illness, caring responsibilities, study, or discouragement. They do not appear in the headline unemployment figures, which is why the inactive total is frequently underreported in political debate.

    Why has economic inactivity increased so much in the UK since the pandemic?

    Long-term sickness is the primary driver, with around 2.8 million people citing illness as their main reason for not working. Mental health conditions, long Covid, and NHS waiting list delays have all pushed people out of the labour market. A separate cohort of over-50s who retired early during the pandemic also failed to return to employment, contributing significantly to the rise.

    Which groups are most affected by economic inactivity in Britain?

    Long-term sick and disabled people make up the largest single group. Unpaid carers, predominantly women aged 35 to 54, form another major cohort. Workers aged 50 to 64 who left the labour market during the pandemic and did not return also represent a significant and growing share of the total.

    What policies could reduce economic inactivity in the UK?

    The most evidence-backed approaches include reducing NHS waiting times so people can receive treatment and return to work, properly funding social care to relieve pressure on unpaid family carers, and reforming hiring practices to reduce age discrimination. Expanding flexible and part-time working options and improving access to retraining for older workers are also cited by researchers as effective long-term measures.

  • Benefit Sanctions, Universal Credit Cuts and the People Being Left Behind by Britain’s Welfare System

    Benefit Sanctions, Universal Credit Cuts and the People Being Left Behind by Britain’s Welfare System

    There is a particular cruelty to a system that is supposed to catch people when they fall but, for many, ends up pushing them further down. The latest round of universal credit cuts UK 2026 has brought that contradiction into sharp focus, with the Department for Work and Pensions rolling out a package of reforms that welfare charities and frontline support workers are describing, in plain terms, as devastating. I’ve spent time looking at the numbers, the testimonies coming out of food banks and advice centres, and the government’s own justification for where it’s heading. What I found is uncomfortable reading.

    People waiting at a job centre, reflecting the impact of universal credit cuts UK 2026
    Photo by zhang kaiyv on Pexels

    What the universal credit cuts actually involve

    The headline change that arrived in April 2026 is the reduction to the health-related component of Universal Credit, specifically the Limited Capability for Work and Work-Related Activity (LCWRA) element. The government has cut the additional amount new claimants with health conditions receive by roughly £47 per week in real terms, while also tightening the eligibility criteria through a revised Personal Independence Payment assessment process. Existing claimants are protected temporarily, but anyone making a new claim faces a substantially lower floor.

    Alongside that, the DWP has extended its sanctions regime. Sanctions, for those fortunate enough not to know how they work, are financial penalties applied to claimants who miss appointments, fail to meet job-search requirements, or are deemed not to be doing enough to find work. The minimum sanction is now a month’s worth of the standard allowance, and repeat breaches can wipe out payments for up to three months. The Joseph Rowntree Foundation, which tracks UK poverty data closely, published research earlier this year showing that sanctioned claimants are between two and three times more likely to experience destitution within 90 days of a sanction being applied.

    The ONS numbers behind the headlines

    The Office for National Statistics released updated poverty figures in February 2026. Relative poverty, measured as household income below 60 per cent of the median after housing costs, stood at 22 per cent of the UK population. That is around 14.3 million people. Child poverty within that figure was at 30 per cent, the highest rate recorded since the ONS began tracking the current methodology. You can read the full dataset at ons.gov.uk.

    What the headline number doesn’t capture is the depth of poverty for those at the bottom. The Resolution Foundation’s analysis of the same data found that around 3.8 million people in the UK now live in what it classifies as absolute destitution, meaning they cannot afford basic essentials including food, heating, or hygiene products on a consistent basis. These are not people who are struggling to keep up with their mortgage. These are people who are sometimes choosing between eating and keeping the lights on. The universal credit cuts UK 2026 changes fall hardest on exactly this group.

    Voices from the sharp end

    Welfare rights advisers at Citizens Advice offices across the Midlands and the North have been documenting what the reforms look like at street level. One adviser in Leeds described a client, a 34-year-old woman with fibromyalgia, who lost her LCWRA element after a telephone assessment she said lasted under 20 minutes. The assessor, according to the case notes the adviser shared, marked her as capable of work-related activity based on her ability to cook a simple meal. She had described relying on pre-prepared food on bad days because she cannot hold a pan safely. Her payment dropped by around £200 per month.

    Another case from Wolverhampton involved a man in his late fifties who was sanctioned after missing a work coach appointment. He missed it because he was in hospital following a mental health crisis. The DWP accepted the reason on appeal, but the process took eleven weeks. During that period, he had no income beyond a hardship payment of roughly 60 per cent of his standard allowance. His landlord issued a notice to quit. He was eventually rehoused, but the gap in his rental history created fresh barriers.

    These are not exceptional cases. Advisers describe them as the daily texture of their work in 2026. The system generates a relentless volume of exactly this kind of outcome.

    The government’s argument and where it falls short

    The DWP argues that the reforms are about making work pay and reducing long-term welfare dependency. The work and pensions secretary has pointed to employment figures showing that the overall rate of economic inactivity, particularly among working-age adults, remains stubbornly high, and that the benefits bill for health-related claims has roughly doubled since 2019. Those are real figures. The question is whether cutting payments to sick and disabled people is the mechanism that gets them into work, or whether it simply makes them poorer.

    The evidence from previous sanction regimes is not encouraging on this. Research published by the universities of Oxford and Glasgow found that sanctions applied to people with mental health conditions were associated with worse health outcomes and no sustained improvement in employment rates. You’d think that evidence base would inform policy design. Apparently not.

    It’s also worth noting that where you live in Britain already determines whether you get proper healthcare, and the people losing welfare support now are often the same people most likely to fall through the cracks of NHS provision. The compounding effect of health-related poverty and healthcare access inequality is something the government’s modelling doesn’t appear to address.

    Food banks, crisis loans and the infrastructure of last resort

    The Trussell Trust reported a 19 per cent rise in emergency food parcel distributions in the first quarter of 2026 compared to the same period in 2025. Around 38 per cent of those parcels went to households where at least one adult was in employment, which punctures the idea that this is simply about people refusing to work. The remainder were largely households affected by benefit delays, sanctions, or the transition between old and new assessment criteria.

    Local councils are also feeling the strain. Discretionary housing payments, budgeted to help people cover housing costs in a crisis, were exhausted in over 40 local authority areas before the end of March 2026. There is no mechanism to top these funds up mid-year. When they run out, they run out.

    This connects to a broader pattern I’ve written about before. Britain’s ageing workforce is already reshaping labour market dynamics, and a welfare system that cannot adequately support people who are genuinely unable to work is going to face increasing pressure as demographics shift. The political narrative of reform-as-toughness only holds if the underlying assumption, that most claimants can work if nudged hard enough, is true. The evidence says that assumption is wrong for a very large number of people.

    Is there any political will to change course?

    The short answer is not much, at least not in the current parliamentary session. The Lib Dems tabled an amendment in April calling for an independent review of the health-related component changes. It was defeated comfortably. Several Labour backbenchers voted against their own government on the reforms, which is notable, but not enough to shift the policy direction. The Green Party has consistently called for a reversal of the cuts and a restoration of the £20 uplift that was removed from Universal Credit back in 2021, but they lack the numbers to force anything through.

    The practical reality is that unless there is a significant shift in the political cost of these reforms, the trajectory is unlikely to change before the next general election. And for the people caught in the middle of the current system, the next general election is a very long way away. What happens to them in the meantime is not an abstract policy question. It is a daily, material reality that the universal credit cuts UK 2026 reforms have made considerably harder.

    Frequently Asked Questions

    What are the main universal credit cuts in the UK in 2026?

    The most significant change is the reduction to the Limited Capability for Work and Work-Related Activity (LCWRA) element for new claimants, worth roughly £47 per week less in real terms. The DWP has also tightened PIP eligibility assessments and extended the sanctions regime, meaning claimants can lose a month’s payment for a single missed appointment.

    Who is most affected by the DWP benefit reforms?

    New claimants with long-term health conditions, disabled people, and those with mental health difficulties bear the sharpest impact. Existing claimants retain some transitional protections, but anyone entering the system from April 2026 onwards faces the new, lower rates from the outset.

    How do Universal Credit sanctions work and how long do they last?

    A sanction is a temporary reduction or removal of your Universal Credit payment if the DWP decides you haven’t met your claimant commitment, for example by missing a job centre appointment or not applying for enough jobs. The minimum sanction period is one month’s standard allowance; repeat breaches can result in up to three months without payment. You can request a hardship payment worth around 60 per cent of your allowance while sanctioned.

    Can you appeal a Universal Credit sanction or LCWRA decision?

    Yes. You can request a mandatory reconsideration from the DWP first, and if that fails, appeal to an independent tribunal. Citizens Advice and local welfare rights organisations can help you gather evidence and prepare your case. The process can take weeks to months, however, so applying for a hardship payment immediately is important.

  • Britain’s Ageing Workforce: What Happens When the Baby Boomers Finally Stop Working?

    Britain’s Ageing Workforce: What Happens When the Baby Boomers Finally Stop Working?

    There is a slow-motion economic crisis unfolding in Britain that gets far less attention than it deserves. While politicians argue about boat crossings and benefit caps, the UK ageing workforce economic impact in 2026 is quietly reshaping every corner of public life. Record numbers of over-50s have left employment since 2020, the working-age population is shrinking relative to retirees, and not a single major party has come forward with anything resembling a credible plan. Oli and I have been watching this story build for years. It feels like a conversation the country keeps nearly having, then abandoning when something noisier comes along.

    The Office for National Statistics puts the number of economically inactive people aged 50 to 64 at around 3.6 million as of early 2026. That is not a rounding error. A significant chunk of that group left the labour market during the pandemic and simply never came back, citing ill health, caring responsibilities, or an early retirement made possible by rising house prices and defined-benefit pension pots. The ONS has consistently flagged this demographic drift as one of the most pressing structural issues facing the British economy, and yet the policy response has been, to put it charitably, patchy.

    Older worker at office desk representing the UK ageing workforce economic impact in 2026
    Photo by EqualStock IN on Pexels

    Why so many over-50s stopped working

    The reasons are layered. Long NHS waiting lists pushed some people out of work permanently because untreated conditions made employment impossible. The postcode lottery in NHS access means that an over-55 in rural Lincolnshire waiting two years for a hip replacement is not going back to a warehouse floor anytime soon. Others left because of burnout, because caring for elderly parents became a full-time reality, or because their employers made them feel unwanted. Age discrimination in UK workplaces is poorly enforced and deeply embedded.

    There is also the question of incentives. A sizeable cohort of baby boomers hit their late 50s sitting on final salary pension schemes that younger generations can only dream of, alongside properties that had tripled in value. If you can retire comfortably at 58, the pull of doing so is obvious. My reading of the figures is that this was not laziness. It was a rational response to the options available. The problem is that the country cannot afford for those options to be quite so attractive when the tax base is shrinking.

    The hit to UK productivity and tax revenue

    Every person who exits the workforce early represents lost output, lost National Insurance contributions, and lost income tax. Multiply that by hundreds of thousands and you start to understand why the public finances are under such sustained pressure. The Resolution Foundation has estimated that the post-pandemic rise in economic inactivity among older workers costs the Treasury somewhere in the region of £8 billion a year in lost tax and higher benefit spending. That is not a small number.

    Productivity is the other side of the coin. Britain’s productivity problem predates the pandemic, but the loss of experienced workers in sectors like manufacturing, healthcare, and financial services has made it worse. Institutional knowledge walks out of the door when experienced people retire, and it takes years to rebuild. Skills gaps in engineering, construction and logistics are already severe. The structural weaknesses in Britain’s gig economy workforce mean that the jobs left behind often go unfilled by permanent, skilled replacements.

    What it means for pensions and public services

    The state pension triple lock is already eye-wateringly expensive, costing the Treasury around £124 billion a year. As the ratio of workers to retirees narrows, sustaining that commitment becomes arithmetically harder. There are roughly 3.2 working-age people for every person over 65 in the UK today. By 2040, that ratio is projected to drop to around 2.5. Nobody has properly levelled with the public about what that means in practice: higher taxes, a later state pension age, or reduced benefits, probably some combination of all three.

    Public services feel the squeeze from both ends. Older populations use more NHS resources, more social care, and more local authority support, while the tax base funding those services contracts. I find it genuinely baffling that this does not dominate budget debates the way, say, benefit fraud does, given that the fiscal implications are orders of magnitude larger. The inheritance tax changes in the 2025 Budget generated enormous heat, but the conversation about who is actually going to fund the NHS and social care in fifteen years barely registers.

    Why no political party has an answer

    Labour has talked about getting more over-50s back into work through “back to work” programmes and occupational health reforms. The Conservatives, while in government, introduced various schemes with similar aims, none of which moved the dial significantly. The Liberal Democrats have pushed for better flexible working rights and carer support, which is reasonable, but incremental.

    The blunt truth is that the real solutions are politically painful. Raising the state pension age further is toxic. Means-testing the triple lock is toxic. Mandating employer retraining programmes costs businesses money and gets lobbied against. Immigration, which could fill some of the gap in the short term, is constrained by political choices that both main parties have made. There is no easy lever to pull, and British political culture is not well set up for governing on long-term timescales when the next general election is never more than five years away.

    There are things that could genuinely help. Reforming occupational health so that employers are legally required to offer meaningful retraining and phased retirement options would keep some people in the workforce longer. Fixing the NHS backlog, particularly musculoskeletal and mental health treatment, would reduce the number of people pushed out of work by untreated conditions. Better funding for adult social care would relieve pressure on the unpaid carers who currently have no option but to leave their jobs. None of this is glamorous. None of it fits on a campaign poster. That is probably why none of it is happening at the speed it needs to.

    The bigger picture nobody wants to discuss

    The UK ageing workforce economic impact in 2026 is not an abstract future problem. It is happening now, in tax receipts, in NHS waiting lists, in planning meetings for future pension liabilities. The baby boomer generation did not create this situation maliciously. They worked hard, paid into a system that made certain promises, and are now collecting on those promises. The generational tension this creates is real, and I think it is only going to intensify.

    Younger workers today are largely in defined-contribution schemes with far less certainty about what they will receive. Many are stuck in the gig economy or in insecure employment. Some are locked out of property ownership entirely. The idea that they will cheerfully pay higher taxes to fund generous pensions for a generation that benefited from free university tuition, affordable housing, and final salary schemes is optimistic at best.

    Britain needs a serious, multi-decade conversation about how it funds an ageing population. The numbers are unforgiving and they are not going to improve on their own. The question is whether any politician is brave enough to start that conversation honestly, or whether we keep kicking it into the long grass until the crisis becomes undeniable. Right now, I’d bet on the long grass.

  • The Motorist Tax Nobody Voted For: How Road Pricing Could Replace Fuel Duty on British Roads

    The Motorist Tax Nobody Voted For: How Road Pricing Could Replace Fuel Duty on British Roads

    There is a financial hole opening up beneath the feet of the Treasury, and it has four wheels. As electric vehicles spread across Britain’s roads, fuel duty receipts are falling fast. The Office for Budget Responsibility has already flagged it: the UK currently collects around £25 billion a year from fuel duty and Vehicle Excise Duty combined, and that figure will collapse as petrol and diesel cars become a minority. The government knows it. And the answer being floated, quietly but with increasing seriousness, is road pricing, a pay-per-mile system that would charge drivers based on how far they travel, when, and where.

    I’ve been watching this one build for a couple of years now, and the conversation has shifted from theoretical to genuinely operational. In early 2026, the Department for Transport confirmed it is actively consulting on road pricing frameworks, with the Treasury’s fingerprints all over the process. The question is no longer really if, it’s how bad, and for whom.

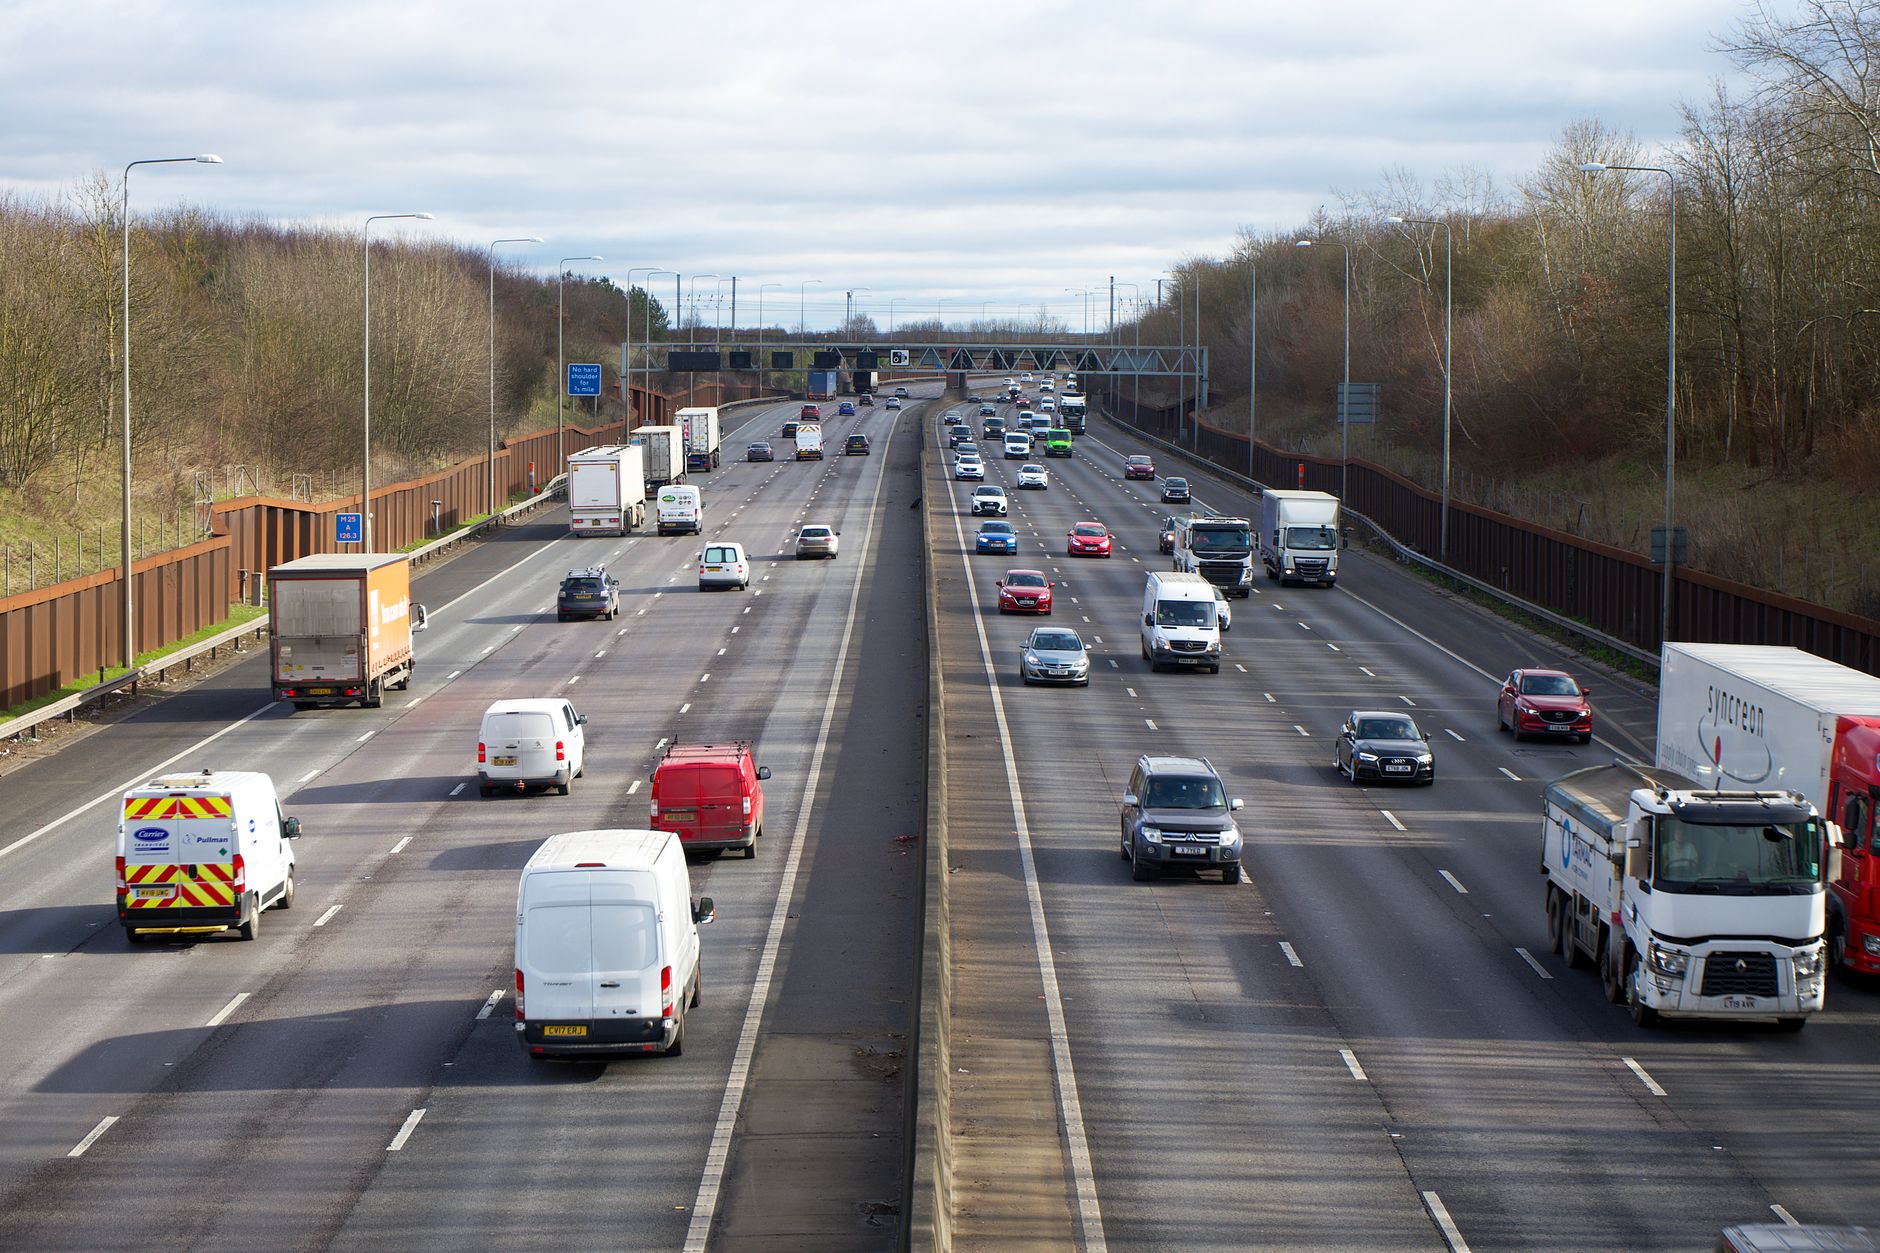
    Heavy motorway traffic in the UK illustrating the road pricing debate
    Photo by Mike Bird on Pexels

    Why fuel duty is dying, and why that matters

    Fuel duty in the UK currently sits at 52.95p per litre, frozen since 2011, but the tax base it relies on is shrinking year on year. According to the Society of Motor Manufacturers and Traders, battery electric vehicles accounted for nearly 20% of new car registrations in 2025. That share will only grow as the 2035 ban on new petrol and diesel car sales approaches. The OBR’s own forecasts show the government losing tens of billions in motoring tax revenue by the mid-2030s if nothing changes.

    That is not a small gap you can quietly plug with minor adjustments elsewhere. It is a structural revenue problem, and road pricing is the mechanism that most credibly replaces it. The logic is straightforward: if you cannot tax the fuel, you tax the miles.

    What road pricing could actually look like in practice

    Several models are being discussed. The simplest involves a flat per-mile charge applied nationally, tracked either through GPS-fitted devices in vehicles or via smartphone apps. More sophisticated versions would introduce variable pricing, more expensive on congested urban routes at peak hours, cheaper on quiet rural A-roads at 2am. This is broadly how the existing London Congestion Charge and ULEZ operate, just scaled up to the entire country.

    The RAC Foundation, which has studied this carefully, estimates that a revenue-neutral replacement for fuel duty would cost the average driver somewhere between 3p and 7p per mile, depending on the model chosen. For someone driving 10,000 miles a year, roughly the UK average according to the Department for Transport, that is between £300 and £700 annually. Not pocket change.

    Car dashboard odometer relevant to road pricing UK mileage charges
    Photo by Gift Lane on Pexels

    Professional drivers would feel this acutely. Taxi and private hire drivers, delivery workers, long-haul couriers, anyone whose livelihood is built around mileage faces a cost structure that changes entirely. Companies like ACE ABC operating in this space will be watching the consultation closely, since the margins in the hire and reward sector are already tight without a new per-mile levy layered on top.

    The rural driver problem

    Here is where the politics get ugly. Road pricing, in almost any form, hits rural and semi-rural communities hardest. A nurse driving 18 miles each way to a hospital on the outskirts of a market town has no realistic alternative. A farmer shuttling between fields has no viable public transport option. The notion that higher per-mile charges would nudge these drivers onto buses or trains is, frankly, detached from reality.

    This connects to a broader issue I’ve written about on this site before. Healthcare inequality by postcode is already a serious problem in rural Britain; adding a punitive cost to getting to the GP or the hospital on top of existing access problems seems like exactly the wrong direction. Rural households also tend to drive more, the average annual mileage for rural drivers is significantly higher than urban counterparts, so a flat per-mile rate is inherently regressive in its geographic impact.

    Any serious road pricing scheme would need robust rural exemptions or subsidy mechanisms built in from day one. Whether any government has the political will to design that complexity is a different question entirely.

    The privacy argument that keeps getting ignored

    A GPS-based tracking system for every vehicle in Britain is not just a tax mechanism. It is a surveillance infrastructure. Your precise movements, when you left the house, which routes you took, how long you stopped at a particular address, would be logged, processed, and stored. The Information Commissioner’s Office would have an enormous governance challenge on its hands, and civil liberties groups are already raising objections.

    Sweden and the Netherlands have both trialled similar schemes and found that public resistance to tracking was one of the biggest barriers to implementation. Britain has a similar instinctive suspicion of state surveillance, and any road pricing rollout that is perceived as a government backdoor into citizens’ daily movements will face significant pushback. The government would need to offer genuinely credible data minimisation guarantees, anonymisation, short retention windows, strict access controls. Whether that is politically achievable alongside the revenue imperatives driving the policy is unclear.

    Is there a fairer way to do this?

    There are alternatives worth taking seriously. A straightforward annual flat charge on all vehicles, essentially an expanded Vehicle Excise Duty, is administratively simple and requires no tracking infrastructure. It would not address congestion pricing, but it would plug the revenue gap without the surveillance baggage. Some economists favour a reformed version of fuel duty that also applies to electricity at the charging point for EVs, a kind of energy-use levy that preserves the basic logic of the existing system.

    What seems increasingly difficult to argue is that the status quo is sustainable. The Treasury cannot absorb a £25 billion annual shortfall. Motorists who switched to electric vehicles partly to avoid fuel duty will, eventually, find that the state finds a different way to reach into their wallets. The debate is not whether driving gets taxed, but how.

    I’d also note that this sits alongside other pressures squeezing ordinary people’s finances right now. Gig economy workers who drive for a living are already navigating precarious income structures; a per-mile road charge on top of rising insurance costs and vehicle maintenance would push some of them out of the market entirely. And for commuters relying on road transport because rail nationalisation has yet to deliver a reliable or affordable alternative, road pricing looks less like a policy and more like a trap.

    The Treasury consultation is ongoing. The Department for Transport has committed to publishing a full framework assessment before any pilot schemes begin. My reading of the direction of travel: some form of road pricing is coming, the only question is how badly the implementation is handled. Watch this space, and watch your mileage.

  • The SEND Crisis: Why Britain’s Special Educational Needs System Is Failing Hundreds of Thousands of Children

    The SEND Crisis: Why Britain’s Special Educational Needs System Is Failing Hundreds of Thousands of Children

    There is a legal entitlement at the heart of this story. Children with special educational needs and disabilities in England have a right, enshrined in the Children and Families Act 2014, to an Education, Health and Care Plan that identifies what they need and compels local authorities to provide it. That right, in 2026, is being routinely ignored. Not through malice in most cases, but through a system so overwhelmed, so underfunded, and so structurally broken that the promise the law makes to some of the most vulnerable children in Britain has become, for many families, a cruel joke. The SEND crisis UK 2026 is not a new story. But it is getting worse, and the people paying the price are children.

    A child receiving one-to-one support in a classroom, illustrating the SEND crisis UK 2026
    Photo by Yan Krukau on Pexels

    The EHC Plan backlog: a queue that never seems to move

    An Education, Health and Care Plan is supposed to take no more than 20 weeks to issue from the point of a request. That is the legal limit. According to figures published by the Department for Education, only around half of all EHC Plans in England were issued within that statutory timeframe in 2024. Some local authorities are far worse. Families in parts of the country are waiting the better part of a year, sometimes longer, while their child sits in the wrong school, receives no support, or simply stops attending altogether.

    I’ve spoken to parents who describe the process as a full-time job in itself. Chasing emails, hiring independent educational psychologists because the council’s assessment waiting list stretches to 18 months, paying solicitors to threaten judicial review. One mother in Lincolnshire told a national paper she had spent £12,000 in legal fees before her son, who has autism and severe anxiety, was allocated a specialist school place. He was nine years old when the process started. He was eleven by the time it concluded.

    The number of children with EHC Plans in England has risen dramatically, reaching over 575,000 in 2024, up from around 240,000 a decade earlier. That near-doubling reflects better identification and diagnosis, greater awareness, and possibly the long-term developmental effects of the pandemic years. But the infrastructure to support those children has not kept pace. The specialist places simply do not exist in sufficient numbers.

    Why councils are going under

    Local authorities in England are legally responsible for delivering SEND support, but the funding model is, and I think this is the only honest word for it, a disaster. The High Needs Block of the Dedicated Schools Grant is supposed to cover specialist provision, but councils have been overspending it for years. According to the Local Government Association, the collective deficit in High Needs funding across English councils ran into hundreds of millions of pounds annually by the mid-2020s.

    The government introduced Delivering Better Value (DBV) safety valve agreements, essentially bailout deals where councils received extra funding in exchange for commitments to reduce their SEND deficits. Critics, including the charity IPSEA (Independent Provider of Special Education Advice), argued these agreements incentivised councils to reduce services rather than improve them. Some local authorities found themselves in the contradictory position of being rewarded financially for issuing fewer EHC Plans or for placing children in cheaper, less suitable provision.

    This links to a wider pattern of public services being asked to do more with less, something we have written about extensively on this site. The postcode lottery that plagues NHS access has a direct parallel in SEND: where you live in England determines, to a startling degree, what support your child will receive. Two children with identical diagnoses and identical needs can have wildly different outcomes depending on whether their family lives in, say, Hampshire or Hartlepool.

    Not enough specialist places

    Even when an EHC Plan is issued, naming a specialist school, getting a place is another battle entirely. Special schools in England are oversubscribed. Many have waiting lists. Maintained special schools cannot simply expand overnight; building new ones requires capital funding, planning permission, and years of lead time. In the meantime, children are placed in mainstream schools that are not equipped to meet their needs, or in independent specialist schools that cost local authorities tens of thousands of pounds per year per pupil.

    That last point matters enormously. The high cost of independent specialist provision is itself driving the financial crisis in SEND budgets. Councils end up paying £60,000, £80,000, even over £100,000 a year for a single child’s placement, because there is no suitable maintained alternative. The system has, in some ways, created a perverse market where the absence of state provision drives families towards private schools, which councils then have to fund anyway, at a premium.

    OFSTED and the Care Quality Commission have jointly inspected local area SEND partnerships since 2016. Their published findings make for grim reading. In a significant number of inspections, they have found that children and young people are not receiving the support their EHC Plans say they should receive. The gap between what is written on paper and what happens in practice is, in some authorities, enormous.

    The human cost nobody should be willing to accept

    Statistics are one thing. But I think it’s worth being direct about what this means in practice. Children with autism, ADHD, cerebral palsy, Down’s syndrome, speech and language disorders, and a hundred other conditions are going without therapies, support workers, and appropriate education. Some are effectively housebound. Some are being excluded from schools that cannot manage their needs. Some are developing secondary mental health conditions as a direct consequence of being failed by a system that was supposed to protect them.

    The crisis in children’s mental health is not unrelated to SEND failures. The strain on NHS CAMHS services, the long waits for diagnostic assessments, the lack of early intervention: these feed each other. The pressures already bearing down on British teenagers are compounded, dramatically, for those who also have unmet educational needs.

    Parents, particularly mothers, are leaving the workforce to manage the fight for their child’s provision. That is an economic cost as well as a human one. According to research from the charity Contact, around one in four parents of disabled children gives up work to care for them, with direct implications for household income, pension entitlement, and long-term financial security.

    What reform actually looks like, and whether it’s coming

    The government published an improvement plan for SEND in 2023, but the sector’s response was, at best, cautious. Proposals included standardising EHC Plan processes, creating more specialist places in mainstream schools, and improving data sharing between councils, health bodies, and education providers. None of this is wrong. But without a serious injection of capital funding and a root-and-branch rethink of how High Needs budgets work, the structural deficit will remain.

    Oskar and I have both followed this story for a while now, and my honest read is that the political will to fix SEND is limited by the scale of what fixing it would actually cost. A genuine solution requires building more special schools, training and retaining specialist staff, funding councils properly, and reducing diagnostic waiting times. The pattern of underfunding creating a crisis, then managing the crisis rather than resolving it, is one we see repeated across British public services.

    The children in this system cannot wait for the politics to catch up. Some of them are losing years they will never get back. The BBC’s ongoing coverage and the work of organisations like IPSEA and the National Autistic Society continue to document individual cases, but the systemic picture remains largely unchanged. You can read the DfE’s own statistics at the government’s Education, Health and Care Plans statistics page, and the trajectory is clear. More children, same broken system.

    Until councils are funded to meet demand, until specialist places exist in sufficient numbers, and until the 20-week legal limit is treated as an actual legal limit rather than an aspirational guideline, the SEND crisis UK 2026 will remain exactly what it is: a systemic failure that the state is choosing, on some level, to tolerate.

    Frequently Asked Questions

    What is an Education, Health and Care Plan and who is entitled to one?

    An Education, Health and Care Plan (EHC Plan) is a legally binding document for children and young people aged up to 25 in England who have special educational needs or disabilities that cannot be met through standard school support. Local authorities must issue one within 20 weeks of a formal request if an assessment shows the child qualifies. It sets out the child’s needs and what provision must be made.

    How long does it actually take to get an EHC Plan in 2026?

    Legally it should take no more than 20 weeks. In practice, many families wait far longer. DfE data shows roughly half of EHC Plans are issued outside that statutory window, with significant variation between local authorities. Some families report waits of 12 to 18 months, particularly in areas with high demand and underfunded councils.

    Why are councils struggling to fund SEND provision?

    The High Needs Block of the Dedicated Schools Grant, which funds specialist provision, has been chronically underspent relative to demand for years. The number of children with EHC Plans has roughly doubled over the past decade, but funding has not kept pace. Many councils carry large accumulated deficits, and placing children in independent specialist schools (which can cost over £80,000 per pupil per year) has pushed budgets further into the red.

    What can parents do if their child's EHC Plan is delayed or refused?

    Parents can appeal to the SEND and Disability Tribunal if a council refuses an EHC needs assessment or issues a plan they disagree with. Free advice is available from charities including IPSEA (Independent Provider of Special Education Advice) and SOS!SEN. Many families also use mediation before going to tribunal, which is a required step in most circumstances.

    Is the SEND crisis worse in some parts of England than others?

    Yes, significantly. The quality and speed of SEND provision varies enormously by local authority. Councils with larger accumulated High Needs deficits, fewer maintained special school places, and higher demand tend to perform worst. This postcode lottery means children with identical needs can receive very different support depending entirely on where their family lives.

  • The Rural NHS Postcode Lottery: Why Where You Live in Britain Determines Whether You Get Treatment

    The Rural NHS Postcode Lottery: Why Where You Live in Britain Determines Whether You Get Treatment

    There is a version of Britain where you wait three weeks to see a GP, another hour for an ambulance that may never arrive in time, and where the nearest specialist unit is a 90-minute drive through single-track roads. That version of Britain is not a dystopian thought experiment. It is daily life for millions of people living outside cities, and the rural NHS access UK postcode lottery is getting worse, not better.

    I grew up not far from a market town in the East Midlands, and I remember my grandmother waiting the better part of an afternoon for a paramedic after a fall. She was fine, as it turned out. But I have thought about that afternoon a lot since. What if it had been worse? What if she had lived 20 miles further from the nearest A&E rather than ten? The geography of healthcare in this country is something most of us do not think about until it matters, and by then it is usually too late to be angry about it in a useful way.

    Small rural GP surgery in an English market town illustrating the rural NHS access UK postcode lottery
    Photo by DΛVΞ GΛRCIΛ on Pexels

    GP surgeries closing in rural areas: the numbers that tell the story

    The closure of GP practices in rural and semi-rural areas has been building for years. According to BBC News, hundreds of GP surgeries across England have shut their doors since 2013, with rural communities disproportionately affected. The reasons are not mysterious: an ageing GP workforce, recruitment difficulty in areas that cannot compete with urban salaries and amenities, and NHS England funding formulas that have historically underfunded rural practices despite the fact that serving a geographically dispersed population costs significantly more per patient.

    In Norfolk, Cornwall, Shropshire, and large swathes of Yorkshire, patients are registering with practices 10 or even 15 miles from their homes because their local surgery has closed or merged into a larger hub. For people without a car, that is not an inconvenience. That is a barrier to care. And older patients, the very people most likely to need frequent GP contact, are often the ones least able to travel. The postcode lottery is real, and it cuts hardest at the people who can least absorb it.

    Ambulance response times: the countryside penalty

    Category 1 ambulance calls, life-threatening emergencies, carry a national target of an average seven-minute response. In London, that target is broadly met. In rural areas, the picture is completely different. NHS England data has repeatedly shown that rural trusts, including South Western Ambulance Service and East of England, routinely record response times two or three times longer than their urban counterparts for Category 2 calls, which cover serious but not immediately life-threatening incidents like strokes and heart attacks.

    A stroke patient in central Manchester has a reasonable chance of reaching a stroke unit within the critical one-hour window. The same patient in mid-Wales or the Scottish Highlands faces odds that are not comparable. The brain damage sustained during that additional travel time is not a statistic. It determines whether someone walks out of hospital or needs residential care for the rest of their life.

    Why the funding formula keeps failing rural communities

    Oli and I have talked about this a fair amount, and the thing that strikes me most is how structural the problem is. This is not simply a matter of individual NHS trusts failing. The Carr-Hill formula, which determines how much money GP practices receive, was designed in an era when rurality was poorly understood as a healthcare cost driver. It has been criticised for decades by rural health campaigners who argue it systematically underestimates the cost of delivering care to dispersed, isolated populations.

    The Rural Services Network, which represents rural local authorities and public bodies, has consistently highlighted that rural residents receive less public funding per head than urban residents across multiple services, and healthcare is no exception. When you layer the rural NHS access UK postcode lottery on top of other pressures, such as fewer pharmacies, longer distances to mental health services, and patchy broadband that makes digital GP appointments impractical, the cumulative disadvantage becomes severe.

    This matters alongside the broader NHS waiting list crisis we have covered before. Urban patients on long waiting lists at least have some access to private alternatives, walk-in centres, or multiple hospital sites. Rural patients often have none of that. The waiting list is the only list.

    The rural mental health gap

    Mental health provision in rural Britain deserves its own article, and probably its own parliamentary inquiry. Specialist CAMHS services for young people, crisis teams, and community mental health workers are all concentrated in cities and large towns. A teenager in a rural area struggling with serious mental health difficulties may wait longer for a CAMHS assessment than a peer in a city, and have nowhere local to go in a crisis. Given what we already know about the pressures on young people’s mental health in the smartphone era, adding a geography tax on top of that is a grim combination.

    Adult mental health services follow a similar pattern. Inpatient psychiatric beds are increasingly centralised in larger facilities, meaning rural patients who require admission may be placed in wards far from home, which disrupts family support at exactly the moment it is most needed.

    What could actually change things

    The solutions get discussed regularly in policy circles. Salaried GP models that remove the financial risk of setting up in a rural area. Expanded roles for paramedics and advanced nurse practitioners who can handle cases that currently require GP contact. Helicopter emergency services for the most remote communities. Telemedicine that actually works, rather than the clunky systems many rural practices were handed during the pandemic. Training incentives that make rural placements attractive to junior doctors.

    None of this is technically complicated. The obstacle is money and political will, and rural communities tend not to be marginal constituencies in the same way that urban swing seats are. That political economy shapes everything, including which NHS problems get emergency attention and which ones get another review.

    The rural NHS access UK postcode lottery is not a new problem, and I am not going to pretend this article has uncovered something nobody knew. What I will say is that the gap between urban and rural healthcare in Britain in 2026 is wide enough that it constitutes a genuine inequality of citizenship. Where you are born, or where you can afford to live, should not determine whether you survive a cardiac arrest or get a cancer diagnosis before it is too late. Right now, in Britain, it does. That is not an acceptable answer from a healthcare system that still, to its credit, operates on the founding principle that care is based on need rather than means.

    The structural inequalities running through British life tend to compound each other. Rural healthcare is one more layer of that, and it deserves far more sustained political attention than it gets between election cycles.

    Frequently Asked Questions

    Which parts of the UK have the worst rural NHS access?

    Areas consistently highlighted for poor rural NHS access include Cornwall, rural Norfolk, Shropshire, mid-Wales, the Scottish Highlands, and parts of Yorkshire and Cumbria. These regions combine GP surgery shortages, long ambulance response times, and limited specialist services in a way that creates a significant healthcare gap compared to urban centres.

    How much longer are ambulance response times in rural areas compared to cities?

    NHS England data shows that rural ambulance trusts frequently record Category 2 response times of 40 to 60 minutes, compared to under 20 minutes in many urban areas. For Category 1 life-threatening calls the gap narrows but does not disappear, and the consequences for time-sensitive conditions like stroke and cardiac arrest can be severe.

    Why are GP surgeries closing in rural towns and villages?

    The main drivers are an ageing GP workforce retiring without enough replacements, difficulty recruiting younger doctors to areas with fewer amenities and career development opportunities, and an NHS funding formula that many argue does not adequately account for the higher cost of serving geographically dispersed rural populations.

  • Dry January to Sober Curious: Is Britain Actually Drinking Less and What Is It Doing to the Alcohol Industry?

    Dry January to Sober Curious: Is Britain Actually Drinking Less and What Is It Doing to the Alcohol Industry?

    Something shifted somewhere between the third lockdown and now, and I don’t think it’s fully sunk in for the drinks industry yet. Britain, historically the nation that gave the world the pub, the pint, and the entirely reasonable excuse of “it’s bank holiday weekend”, appears to be genuinely, measurably drinking less. Not dramatically, not universally, but the trend is real and the numbers back it up.

    The phrase “sober curious” would have sounded absurd in a Wetherspoons ten years ago. Now it’s a movement with its own shelf space at Waitrose. The question worth asking is whether UK alcohol consumption falling is a lasting cultural change or a statistical blip that disappears the moment the economy picks up and everyone needs a stiff drink again.

    Supermarket shelf of non-alcoholic drinks reflecting UK alcohol consumption falling in 2026
    Photo by Sylwester Ficek on Pexels

    What the ONS data actually says

    The Office for National Statistics has been tracking drinking habits for years, and the direction of travel is consistent enough to be hard to ignore. Alcohol-specific deaths have been rising, yes, but the headline consumption figures tell a different story: the proportion of adults who describe themselves as non-drinkers has grown steadily, and weekly alcohol consumption per person has been on a long, slow decline since the mid-2000s peak.

    More specifically, around 20% of adults in England now say they don’t drink at all. Amongst 16 to 24-year-olds, that figure is notably higher than it was for the equivalent age group a generation ago. Gen Z is, by most measures, the most sober generation Britain has produced in living memory. My reading of these figures is that this isn’t just a cost-of-living squeeze forcing people to buy fewer bottles of wine; something genuinely cultural is happening beneath the surface.

    The 2025 data published earlier this year showed that average weekly units consumed by drinkers in England dropped again, continuing a pattern that’s been in motion since roughly 2009. The big drinking occasions haven’t vanished, but the routine midweek bottle of red, the after-work pint as a reflex rather than a choice, those are disappearing from a lot of people’s lives.

    Why younger Brits are opting out

    I’ve spoken to people in their twenties who treat alcohol the way their parents treated cigarettes: something older people did, vaguely glamorous once, now a bit odd. That’s a cultural shift that no amount of marketing spend is easily going to reverse. Several things seem to be converging.

    Mental health awareness is a significant part of it. Anyone who’s been following the conversation around how digital environments are affecting young people’s wellbeing will know that this generation is, on balance, more anxious, more health-conscious, and more aware of what alcohol does to sleep and anxiety than previous generations were. You can’t run a campaign in 2026 telling people a glass of wine “takes the edge off” without someone pointing out that it actually worsens REM sleep and increases cortisol the following morning.

    Cost is part of it too. Going out in any British city centre is expensive. A round for four people in London can clear £40 without anyone having done anything particularly extravagant. When you’re in precarious employment or watching your rent eat most of your take-home, cutting alcohol is one of the easier financial decisions to make.

    There’s also simple product improvement. Low and no-alcohol options used to be genuinely awful. Watery, sweet, deeply unimpressive. That’s no longer true. Brands like Lucky Saint, Adnams Ghost Ship 0.5%, and Seedlip have made the alternative shelf genuinely worth browsing.

    How the drinks industry is scrambling to adapt

    The alcohol industry’s response to UK alcohol consumption falling has been, depending on your perspective, either impressively agile or slightly desperate. Probably a bit of both.

    Every major drinks manufacturer now has a low or no-alcohol line. Heineken’s 0.0 is their fastest-growing product in the UK. Guinness 0.0 managed to win over enough drinkers to make it a permanent fixture rather than a novelty. The supermarkets have responded in kind: Tesco, Sainsbury’s, and M&S all expanded their non-alcoholic ranges significantly over the past two years, and they’re reporting double-digit growth in that category annually.

    The premiumisation play is also worth noting. If people are drinking less, the drinks that remain need to feel worth drinking. Craft spirits, single-estate wines, small-batch gins: the logic from producers is that consumers who are cutting down want fewer, better drinks rather than more average ones. It’s a reasonable bet, and sales figures for premium spirits have held up better than mid-range products.

    Pubs are having a harder time. The death of the high street and the ongoing closure of pubs is a separate and painful story, but the sober-curious trend does complicate an already difficult picture. A pub that relies on volume drinking faces a structural problem if more of its regulars are on sparkling water or a £4.50 non-alcoholic craft lager. The ones adapting well are expanding food offerings, investing in atmosphere, and treating no-alcohol options as a proper part of the menu rather than an afterthought.

    Dry January and the commercialisation of sobriety

    Alcohol Change UK’s Dry January campaign has become one of the UK’s more successful public health nudges. Over nine million people attempted it last year, and the organisation’s own research suggests that participants drink less for months afterwards, not just during January. That’s meaningful population-level behaviour change achieved through a voluntary, non-punitive mechanism.

    But there’s a slightly uncomfortable irony in how commercial the “sober” space has become. Alcohol-free spirits can retail for more than their boozy equivalents. Wellness retreats charge premium prices to help you not drink. I’m not dismissing any of it, because if the outcome is that people drink less and feel better, the commercialisation probably doesn’t matter. I’d just note that the drinks industry has found a way to monetise sobriety almost as effectively as it monetised drinking.

    What this means for the pub and the broader economy

    The economic implications of UK alcohol consumption falling aren’t trivial. The alcohol industry directly employs hundreds of thousands of people across brewing, distilling, hospitality, and retail. Excise duty on alcohol raises several billion pounds annually for the Treasury. A sustained structural decline in consumption has fiscal consequences that haven’t really been publicly debated.

    It also creates winners and losers in unexpected places. Soft drink manufacturers are doing well. Premium water brands. Coffee shops, which increasingly occupy the social role that pubs did for previous generations of young people. The shift is gradual enough that no single industry is facing an overnight crisis, but the direction is clear enough that smart operators are repositioning now.

    Britain isn’t becoming teetotal. The binge-drinking figures haven’t disappeared, the festival season still looks like festival season, and a warm weekend in June will still clear out the beer garden of every pub within walking distance of a park. But the baseline, the routine, unthinking drinking that characterised British social life for generations, that is genuinely declining. And the industries that built their models on it are going to have to keep moving to stay relevant.

    Frequently Asked Questions

    Is UK alcohol consumption actually falling or is it just a trend among young people?

    ONS data shows a genuine long-term decline in average weekly alcohol consumption across all adult age groups in England since the mid-2000s, though the drop is most pronounced among 16 to 24-year-olds. It’s not solely a generational phenomenon, but younger adults are driving the most visible shift.

    What percentage of British adults don't drink alcohol?

    Around 20% of adults in England now describe themselves as non-drinkers, according to ONS figures. That proportion has grown steadily over the past decade and is higher still among Gen Z.

    Are non-alcoholic drinks actually good now or is it all marketing?

    Product quality has genuinely improved. Brands like Lucky Saint, Guinness 0.0, and Seedlip have invested heavily in flavour and mouthfeel, and independent taste tests consistently rate them well above the low-alcohol options available a decade ago. The category has moved well beyond watered-down lager.

    How is Dry January affecting the drinks industry?

    Dry January, run by Alcohol Change UK, now sees around nine million participants annually. Research from the campaign found participants typically drink less for several months afterwards, creating a measurable dip in January sales that the industry now plans around with low-alcohol product promotions.